Monitoring TFS 2015 availability from F5 LTM

Introduction

If redundancy and performance are the thing you are looking for your TFS application tier setup, for sure you stumbled upon the term Network Load Balancing (NLB). Microsoft describes the benefits of such a setup and prerequisites in the document named How to: Create a Team Foundation server farm (high availability), thus I will not go in the details about these topics if you continue reading. However, in the documentation, Microsoft encourages you to setup the NLB feature that is integrated in the Windows Server operating system. In many situations that is not an option due to the network restrictions or company policies and the only choice is to use preexisting networking appliances. Reasons for using a hardware based NLB can also be a performance as it offloads the AppTier machines from this task that, for how minor it can be on today’s machines, it adds some load.

Monitoring

In case of using the Windows NLB feature, nodes participating in the pool of the machines used for the load distribution are monitored directly by the system itself, meanwhile for the hardware based solutions we need to setup a health monitor. This is essential as the load balancer needs to know if the node is available and in healthy state, otherwise it is excluded from the pool and the traffic is not sent towards that node.

Now, what is the best practice when it comes to the health status of TFS? Googling around you can’t find much, there are some pointers towards a SOAP method called GetServerStatus exposed, however it doesn’t bring the necessary information.
Luckily there is a non documented rest resource that is exposed on TFS 2015 and beyond and you can reach it at the URL

http(s)://your.tfs.address:port/tfs/_apis/health

It will return just a simple current time stamp by default using the JSON notation. Accessing this resource still requires the user to be authenticated.

When it comes to the F5 in particular, you need to create HTTPS Health Monitor (Local Traffic > Monitors > Create…)

f5-health-monitor

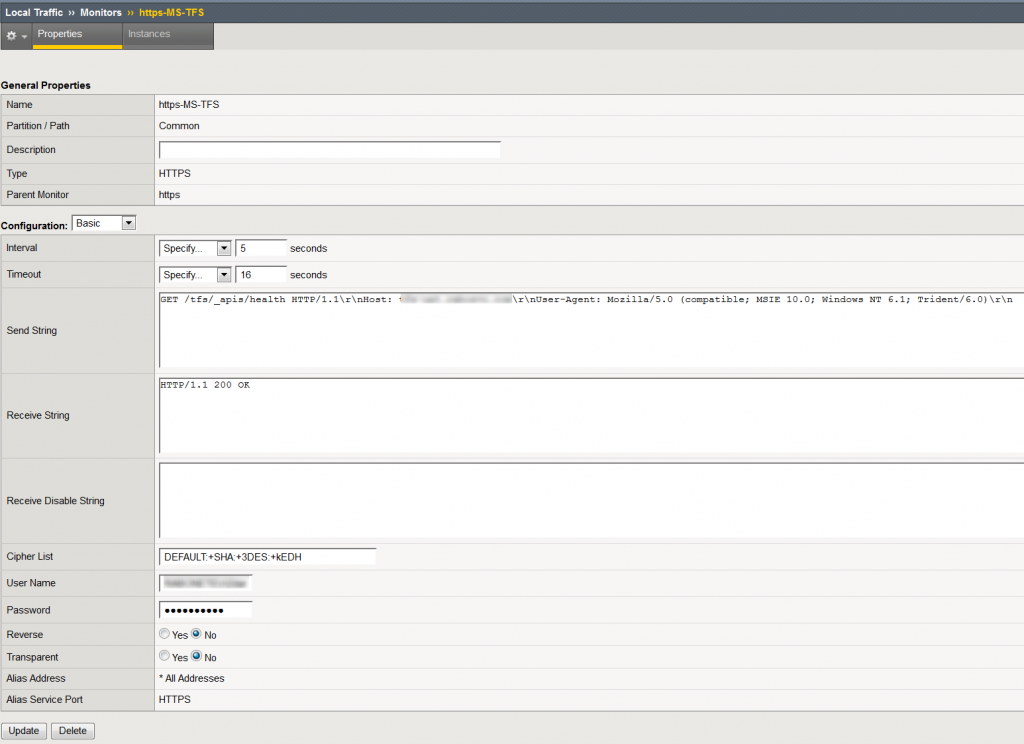
The most important fields to set are Send and Receive string. Here we will send a request towards TFS at the above mentioned address and expect a status code 200 in the response. We can ignore the time stamp in the response body.
The send string will be:

GET /tfs/_apis/health HTTP1.1\r\nHost: your.tfs.address:port\r\n

meanwhile the receive string should be set to:

HTTP/1.1 200 OK

A simple check that the request succeeded (we are not interested in the timestamp in this case).

Do not also forget to provide a username and password of the account that has sufficient rights to access this resource on your TFS server. Username needs to be provided in the form of DOMAIN\UserName. A bare minimum of access rights are necessary for accessing this resource and a View instance-level information permission on the server level is more than sufficient. You can set server-level permissions from the Team Foundation Administration Console or using the TFSSecurity command line tool. Now assign the newly created health monitor to your NLB pool and you are ready to go.

In case you are trying to do so from a script for some of your custom dashboards, I wrote a CmdLet that will return true or false based on the response received from the call to the above mentioned REST resource.

function Get-ServerStatus()
{
	[CmdletBinding()]
    [OutputType([bool])]
	param
	(
		[parameter(Mandatory = $true)]
		[Uri]$url,
        [System.Management.Automation.PSCredential]$credential
	)
	BEGIN
    {
        if ($url.AbsoluteUri)
        {
            $url = $url.AbsoluteUri.TrimEnd('/')
        }

        Add-Type -AssemblyName System.Net.Http
	}
	PROCESS
	{
		$httpClientHandler = New-Object System.Net.Http.HttpClientHandler
 
        if ($Credential)
        {
		    $networkCredential = New-Object System.Net.NetworkCredential @($Credential.UserName, $Credential.Password)
		    $httpClientHandler.Credentials = $networkCredential
        }
        else
        {
            $httpClientHandler.UseDefaultCredentials = $true
        }

        $httpClient = New-Object System.Net.Http.Httpclient $httpClientHandler

        try
        {
			$response = $httpClient.GetAsync("$url/_apis/health").Result
 
			if ($response.IsSuccessStatusCode)
			{
				return $true
			}
 
			return $false
        }
        catch [Exception]
        {
			$PSCmdlet.ThrowTerminatingError($_)
        }
        finally
        {
            if($null -ne $httpClient)
            {
                $httpClient.Dispose()
            }
 
            if($null -ne $response)
            {
                $response.Dispose()
            }
        }

		return $false
	}
	END { }
}

It is sufficient to invoke this cmdlet by passing in the URL of your TFS instance and eventually the credentials. If no credentials are provided, current process credentials will be used.

$uri = "http(s)://your.tfs.address:port/tfs"
$credential = Get-Credential

$state = Get-ServerStatus $uri $credential

A simple solution is now in place that will keep other tools informed about the availability of our TFS instance.

Good luck!

Visual Studio Code behind a proxy

This post is kind of a continuation of Tough life behind a proxy series. This time is the moment of Visual Studio Code. This application does require the web access when it come to plugin installation. If you are behind a proxy, it will not be the easiest thing to achieve.

To set the proxy in Visual Studio Code you need to edit the User Settings. You can do so by opening them from the Preference menu:

user_settings

Once you open it you will be presented with a screen showing the default settings and your user settings file that does override the default settings:

override

Now you can enter the following:

// Place your settings in this file to overwrite the default settings
{
 "http.proxy": "http://my.proxy.address:8080",
 "https.proxy": "http://my.proxy.address:8080",
 "http.proxyStrictSSL": false
}

Some of these information is quite easy to retrieve on interweb, however often they do not mention https and disabling strict SSL. In order to install your extension this is a necessary setting.
Make sure you have the latest version of Visual Studio Code installed before testing this as in some older versions this was not supported.

Save your settings and restart Visual Studio Code. Try now installing an extension, it should be a success.
If you are unaware on how to install an extension in Visual Studio Code, you can find more about this argument in the following blog post Announcing PowerShell language support for Visual Studio Code and more! under “Installing the extension” paragraph. To check the available extensions, please visit Visual Studio Marketplace.

Cheers

Running XL TestView as a service

Introduction

If you started working with XL TestView you may have noticed in the user manual the following: ‘To run XL TestView as a service on Microsoft Windows, use a service runner.’. This differs quite a bit from other products of XebiaLabs that you may have used, as XL Deploy, where a yajsw (Yet Another Java Service Wrapper) is provided. Yet Another Java Service Wrapper will take care of adding the service into your system and handling all of the necessary. This is however not the case with XL TestView. I’m going to show you a proven way of running XL TestView as a service via NSSM.

The Non-Sucking Service Manager

NSSM – the Non-Sucking Service Manager is a tool which allows any application/executable to run as a windows service without much hassles. As an advantage above other tools of this kind is the fact that it handles failure of the application running as a service. Also the users are helped with a graphic interface during the configuration.
In order to start, download NSSM and extract the content of the zip file in a folder that we are going to create in program files, like C:\Program Files\NSSM. NSSM should work under Windows 2000 or later. Specifically, Windows 7 and Windows 8 are supported. 32-bit and 64-bit binaries are included in the download and I will use for this example the 64 bit version. For installing NSSM correctly the last thing left to do is to add the NSSM path to the system path.
Open Control Panel > System and Security > System and choose Advanced System Settings. This will open the System Properties window.

SystemProperties

In System Properties window choose Environment Variables and the namesake window will open.

EnvironmentVariables

In lower part of that window you will find system variables. Search for the system variable called Path, select it and choose edit. Now, this is the part which defers in between different versions of Windows. In Windows 10 and Windows Server 2016 you will be presented with an editor and previous versions will show all of the variables in a text box. I will show you how this is done on Windows 10, however on earlier versions of Windows get at the end of the string in the text box, and add ;C:\Program Files\nssm\win64. Notice that the semicolon at the beginning is not a typo. Multiple items in that string are separated by semicolon. In case of Windows 10 just choose New and add the path to the list.

EditEnvironmentVariables

In order to verify that is all setup correctly, open the command prompt and execute the following command, nssm. You should see something similar to what shown in the following figure.

CommandNSSM

If this is the case, you installed NSSM correctly.

Creating the service

Before proceeding any further make sure that you are able to run XL TestView interactively as indicated in the user manual. Once XL TestView is installed correctly and capable of starting, stop it (CTRL+C).
Now execute the following command, nssm install xltv. This will launch NSSM graphic interface which will allow you to create a new service called xltv. You should see the following

NSSMInstaller

Fill in the path to the server.cmd (starting point for XL TestView) in the path box as in the picture, and start-up directory will get preset by NSSM. Select then the second tab named Details and set the values as indicated in the following figure:

NSSMInstallerDetails

As you can see, I have chosen a friendlier display name for my service and a meaningful description.

In case you would like to set other parameters, as specific user to run the service or specify dependencies, you can do so in other tabs. Once done it is sufficient to choose Install service and in case everything went fine, you will receive the following message:

NSSMInstalled

You can now check in the Services panel, that a new service is present. In case it hasen’t been started, you can start it and verify that XL TestView is up and running.

Services

Be aware that XL TestView can take a bit to start. I would suggest also to set the startup type to Automatic (Delayed start) and this can be done directly from the service properties.

I you would like to modify the NSSM setup, run nssm edit xltv. In case you would like to remove the service, try nssm remove xltv.

That’s all folks, now also XL TestView runs as a service!